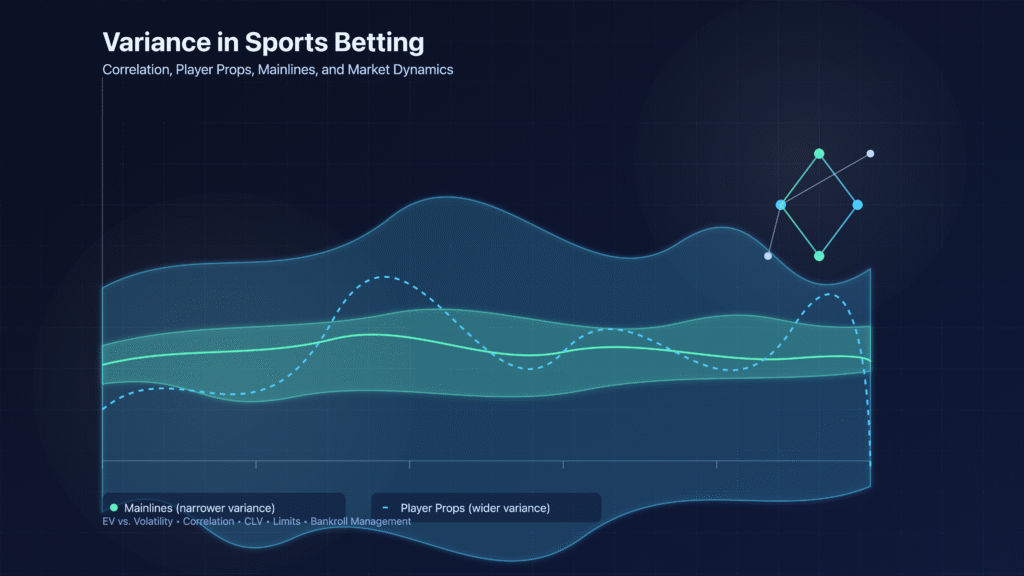
Variance EV% Map
Stable, non-growing charts. KPIs on top, histograms and sample paths below.
Initial capital.
Number of bets simulated per EV% group.
More simulations = smoother histograms, slower compute.
Applied to all EV% groups.
Example: 1,2,3,4,5.
Applied to payouts on wins.
$
Fixed: $ amount. Percent: % of bankroll. Kelly: f × Kelly*.
0 = no bet, 1 = full Kelly.
Set for reproducible results.
Idle
KPIs
Charts
Notes:
– p = (1 + EV_decimal)/d_eff, with EV_decimal = EV% / 100 and d_eff from odds and commission.
– Reset clears canvases, legend, and KPIs; Run recomputes from inputs.
– Lock chart heights prevents any vertical size change across runs.