
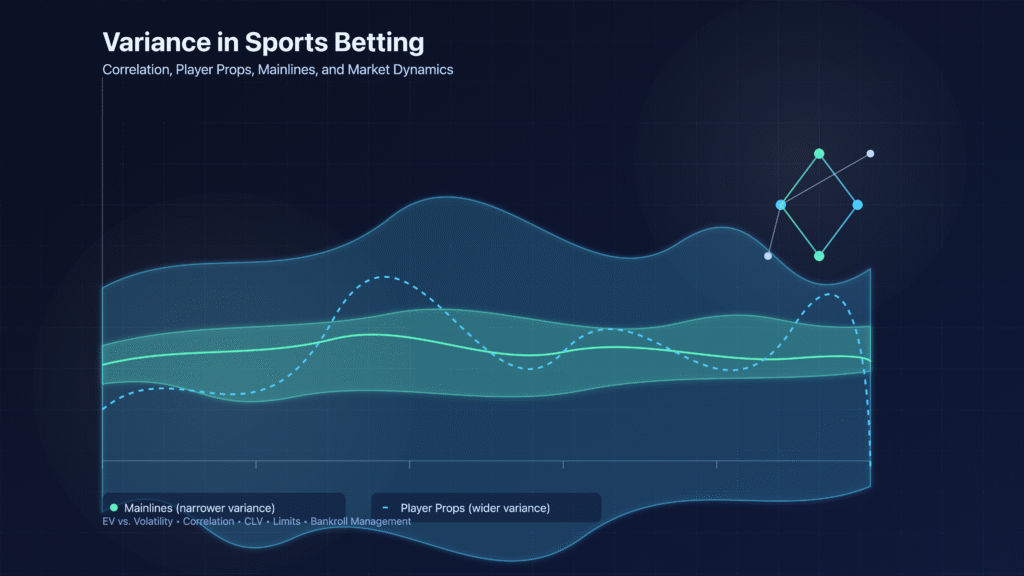
Sports betting is a game of edges played in a storm of randomness. Variance is the name we give that storm. Understand variance and you’ll price risk better, choose the right markets, stake smarter, and avoid common traps—especially with correlated markets like player props, same game parlays, and derivative lines.
This guide covers:
- What variance is (and isn’t)
- How variance differs by sport, market, and timeframe
- Correlation: team totals, player props, and same-game dynamics
- Sample size, streaks, and bankroll management
- Closing line value (CLV) versus short-term results
- Market structure: openers, limits, and how variance evolves through the day
- Modeling tips, simulation, and practical heuristics
- Variance 101: The distribution, not the outcome
- Expected value (EV): Your average profit per bet if repeated indefinitely.
- Variance: How spread out outcomes are around the expectation.
- Volatility vs. edge: A highly volatile bet can be +EV or -EV; volatility alone doesn’t tell you that.
- Key mental model: In the short run, variance dominates your results; in the long run, your edge dominates variance, but the “long run” can be much longer than you think.
- Sources of variance in sports betting
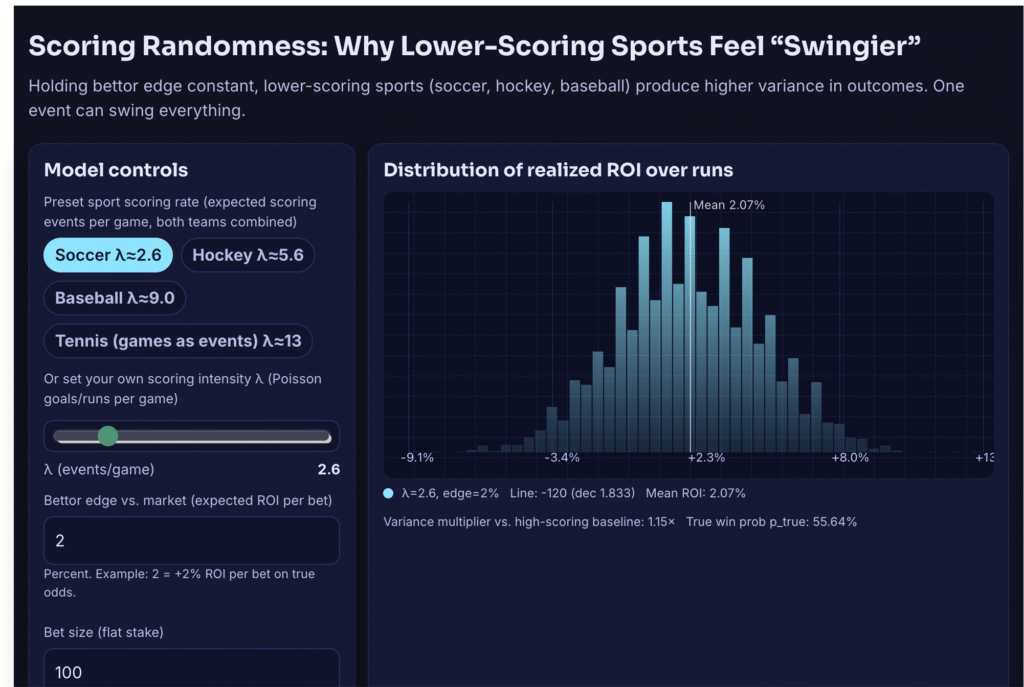
- Scoring randomness: Lower-scoring sports (hockey, soccer, baseball) have higher variance in game outcomes per unit edge; one event (like a defensive mistake or bad pitch) changes everything. This is versus high scoring games like Basketball or even Football when there can be many scoring and impact plays. Check out Scoring Randomness Calculator here to see how sports can vary and mess with your ROI.
- Market type:
- Main markets (spread/total/moneyline): Highest limits, lower relative variance versus props because prices are sharper and distributions are better understood.
- Derivatives (1H, quarters/periods, team totals): Moderate limits; variance depends on possession structure and scoring rules.
- Player props: Higher variance—performance is a narrow slice of team outcome, subject to rotations, injuries, coaching, and small samples.
- Futures: High variance and long settlement; bankroll tie-up increases risk even if edge exists.
- Information flow: Late breaking injury news, weather, umpire/ref assignments, lineup confirmations. Early markets have wider uncertainty; variance of fair price narrows as information arrives.
- How variance changes through the cycle (open to close)
- Openers: Books post lower limits. Lines swing more with sharp action because uncertainty is high. Variance of the true price is widest here.
- Midday: Liquidity increases, more data comes in (market-making influence, modeling refinements). Limits ratchet up; price volatility compresses.
- Close (right before game): Markets are most informed. Limits are highest. Price variance is narrowest. Beating the closing line consistently is a strong proxy for having an edge.
- In-game: Micro-variance spikes. Single plays can shift win probability dramatically. Model latency, feed delays, and suspension risk add operational variance.
- Correlation: the hidden engine behind props and SGPs
- Positive correlation: Outcomes that move together (QB over passing yards and WR1 over receptions; game over and QB over; team spread -7 and opponent RB under attempts).
- Negative correlation: Outcomes that move opposite (Under game total and most offensive overs).
- Same Game Parlays (SGPs): Books often under-account or over-account for correlation. Some price SGPs with built-in correlation adjustments, but exploitable pockets appear around injuries, role changes, or pace mismatches. Always sanity-check: Does adding a leg meaningfully increase the conditional probability of the others?
- Team totals vs. full game totals: If you like the favorite and the over, you may be double-counting the same thesis. Sometimes the team total offers cleaner exposure with lower vig.
- Props vs. mainlines: Player overs are usually directionally correlated with team success and overs on totals. To avoid correlation traps, hedge by targeting props that benefit in multiple scripts (e.g., pass-catching RB receptions can rise in trailing game scripts).
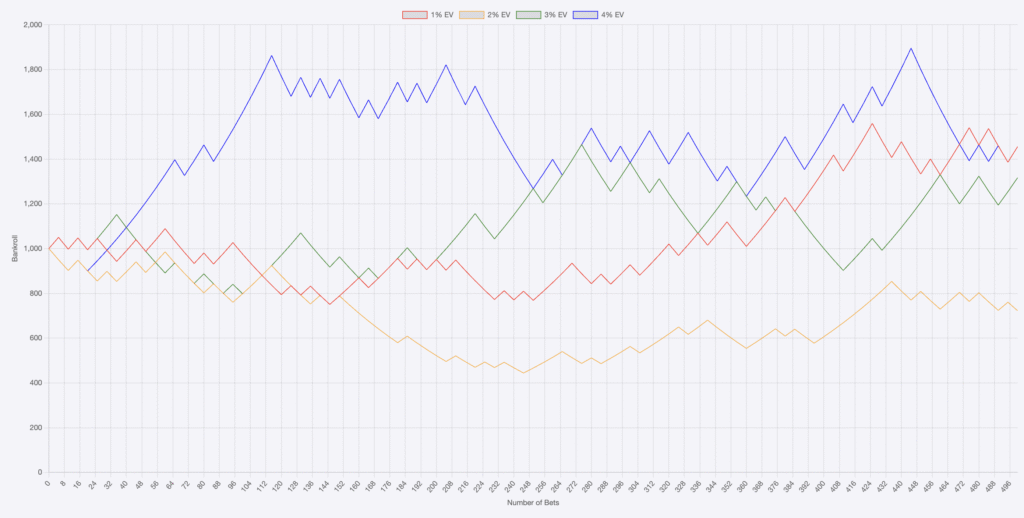
If you look at this graph, there are % EV edges that you have. And let’s assume they are calculated successfully. You can see below with a 500 bet sample, starting bankroll of a modest $1000, and +100 (even odds) that with Non-correlated bets you still will have wild variance. In this model 3% and 2% outperform 4% EV edges.
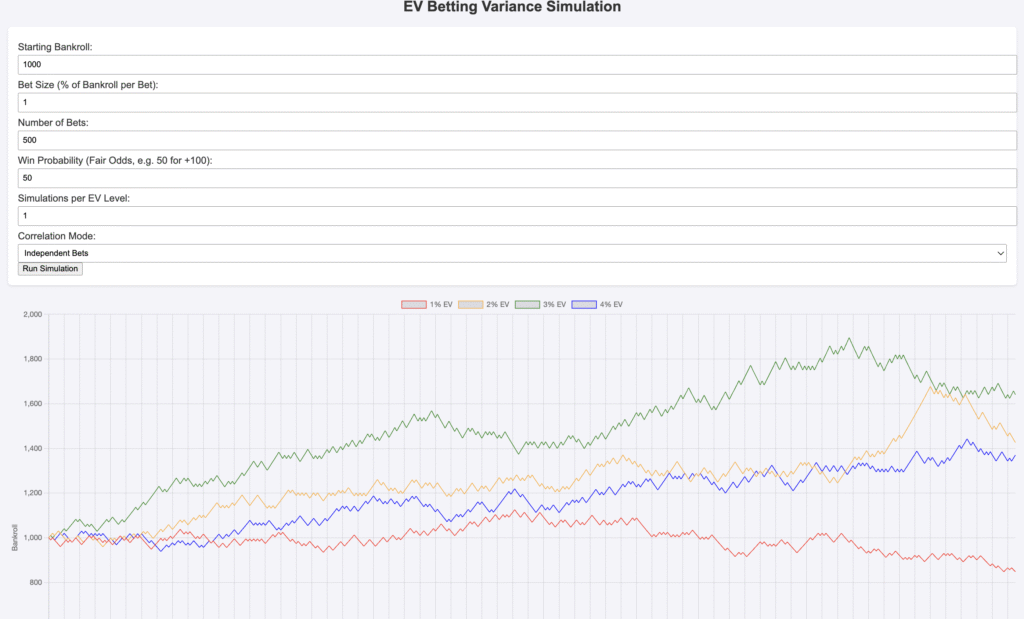
I did run the model with 500 variations and that does smooth out the results for 4% edges winning out. But I show you this because in one bettors journey you could be completely different than the next guy/gal. The numbers at scale show 4% edges are best (which makes sense with correctly calculated edges) however just because Person X has amazing results, YOU could have mild results.
- Player prop variance: why it’s bigger than you think
- Distribution shape: Many props are right-skewed (e.g., receptions, assists) or zero-inflated (e.g., soccer goals, baseball home runs). Means ≠ medians; pricing should be distribution-aware, not purely Gaussian.
- Role uncertainty: Snap share, minutes, rotations, foul trouble, platoons, pitch counts, usage rates. A 10% role change can move fair price more than a 10% talent change.
- Opponent and pace: Possessions drive counting stats; tempo changes variance. Faster pace increases both mean and variance.
- Injury and coach volatility: Late scratches or minutes caps drastically widen the distribution. Books protect with lower limits and faster moves; you protect with conservative staking and alerts.
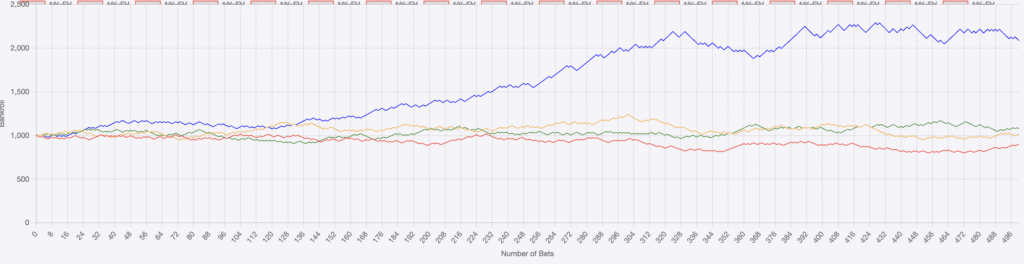
Now if we look at correlation in your bets (especially I see this in player props) you are hurting yourself more than you know it by taking 5, 10 player props in one game/market. The model I ran had 5 bets per game (assume Player Hits/Strikeouts (more strikeouts means less possibility of a hit), or Player Points/Assists (if you are scoring you probably aren’t passing), or Passing Yard/Receiving Yards (if you are receiving yards, the QB is passing them) etc)

You can see in this, the massive variance (noted by the peaks and valleys of the graph) that while it does maintain a semi-upward move, that you will experience a lot more pain along the way.
- Main markets: variance by sport
- NFL: Fewer games, high parity, high public money. Individual plays swing win probability a lot. Totals influenced by weather and officiating trends.
- NBA: Higher scoring reduces game outcome variance; player prop variance is affected by rotations and blowouts. Live betting is more stable between whistles.
- MLB: Run-scoring is lumpy; pitcher matchups and bullpen variance are pivotal. Totals sensitive to weather, park factors, and umpire zones.
- NHL: Low scoring → high outcome variance; empty-net effects matter for pucklines and player points.
- Soccer: Very low scoring; red cards dominate variance; xG can out-predict results in small samples but finishing luck is huge in any one match.
- NCAAF/NCAAB: Information asymmetry is large in smaller conferences; blowout risk and pace differences amplify variance.
- Sample size, streaks, and regression
- The hot-hand illusion: Short streaks happen frequently under randomness. Don’t overfit.
- Regression to the mean: Extreme performances tend to move toward long-run averages as sample grows. Build priors (career, rolling windows) and blend.
- Small samples need larger edges: A 3–5% theoretical edge can take hundreds of bets to “show up.” Plan your bankroll to survive normal drawdowns.
- Bankroll management and staking under variance
- Kelly Criterion (fractional): Stake = edge / odds-implied variance. Full Kelly is aggressive and increases drawdowns; many pros use 20–50% Kelly.
- Flat betting: Simple and variance-friendly if your edges are small and uncertain.
- Max payout caps and correlation: Don’t over-concentrate exposure on correlated positions (e.g., multiple overs tied to the same game script).
- Risk-of-ruin: With small edges and high variance, even “good” bettors can experience long losing streaks. Use simulations to estimate drawdown and set stop-loss limits.
- Closing Line Value (CLV) versus results
- CLV: Beating the closing number is the most reliable early signal of an edge. It correlates with long-term profitability even if short-term ROI lags. Variance is a part of this, even if you are beating CLV 60-70-80% of the time.
- Don’t confuse market drift with true CLV: If your bet moved because of late injury news aligning with you, that’s still CLV—but ask whether it was skill or luck. The goal is repeatability.
- Props CLV is noisier: Low limits and faster repricing can distort the CLV signal. Track large samples and compare by market type.
- Practical modeling and measurement
- Use distributions, not just point estimates:
- NBA/NFL player stats: Poisson-binomial, negative binomial, or zero-inflated Poisson can outperform naive normals.
- MLB: Run environment via run expectancy, park factors; pitcher projections blend stuff metrics + rest + weather.
- Simulate: Monte Carlo to derive fair prices and correlation matrices for SGPs and multi-leg parlays.
- Account for dependencies: Pace, game script, lineup interactions, foul/injury rates. Build conditional trees (if team leads by X at Y time, how do player rates change?).
- Update with Bayesian methods: Start with priors (season-long rates) and update on recent form, injuries, role changes.
- Sanity checks: Compare to market, track error, audit big misses. A model that can’t beat close on middling limits likely needs rework.
- Limits, liquidity, and how variance meets operations
- Betting Early = low limits, high mispricing potential, high variance of fair price. Great for model-driven bettors but bankroll swings can be sharper.
- Betting Late = high limits, sharper prices, lower mispricing frequency. Great for scaling, harder for finding big edges.
- Live = micro-edge hunting; latency and suspensions add execution variance. Use auto-bet tools judiciously; prefer TV delay parity and fast data.
- Weather, officiating, and contextual factors
- Weather: Wind and temperature strongly affect football passing totals and MLB scoring; humidity and air density matter for HR odds.
- Ref/umpire profiles: Pace of play, foul rates, strike zones shift both mean and variance.
- Travel and rest: Back-to-backs in NBA, bullpen fatigue in MLB, short weeks in NFL. Variance grows when uncertainty in player availability increases.
- Common pitfalls
- Double-counting correlation across multiple bets on the same thesis.
- Chasing steam without understanding why the move happened.
- Overreacting to small samples (two hot weeks ≠ new baseline).
- Ignoring max payout and personalized limit rules that distort risk.
- Overfitting models to historical props lines that were themselves noisy.
- Actionable heuristics
- If your bet depends on a fragile assumption (minutes cap, weather window), size down.
- When correlation is your friend (SGPs), build coherent narratives with conditional logic, but make sure price reflects correlation savings.
- Diversify scripts: Mix overs and unders across players who win in different game states.
- Track your own volatility: Maintain a rolling distribution of returns; expect drawdowns 2–3 standard deviations several times a season.
- Measure edge in cents, not vibes: Convert projections to fair odds, compare to vig-adjusted book prices, and keep a ledger of expected vs. realized.
- Quick FAQ
- How many bets do I need before my edge “shows”? Often thousands. Track CLV and ROI by market.
- Is higher variance bad? Not if paid for. You can accept higher variance for higher edge if bankroll supports it.
- Are props “easier”? Sometimes to find edges, but sizing must be smaller; variance and limits are harsher.
- Do I hedge? Hedge when it materially improves your bankroll utility, not to “lock profit” at negative EV.
- What’s the best time to bet? When your information advantage exceeds the market’s. That could be at open (model edges), after lineups (props), or near close (news-driven).
Bottom line
Variance is unavoidable. It isn’t you, it is math. So don’t worry! Your job is to price it, size it, and structure your portfolio so that randomness doesn’t knock you out before your edge compounds. Understand correlation, respect limits, build distribution-aware models, and judge yourself by process (CLV, discipline, bankroll health) as much as by short-term results. If you want, share your sport/market focus and I’ll tailor a variance and staking plan, including target bet sizes and expected drawdown bands.